ANNOUNCEMENT : ALL OF ROYAL MAIL'S EMPLOYMENT POLICIES (AGREEMENTS) AT A GLANCE (Updated 2021)... HERE
ANNOUNCEMENT : PLEASE BE AWARE WE ARE NOT ON FACEBOOK AT ALL!
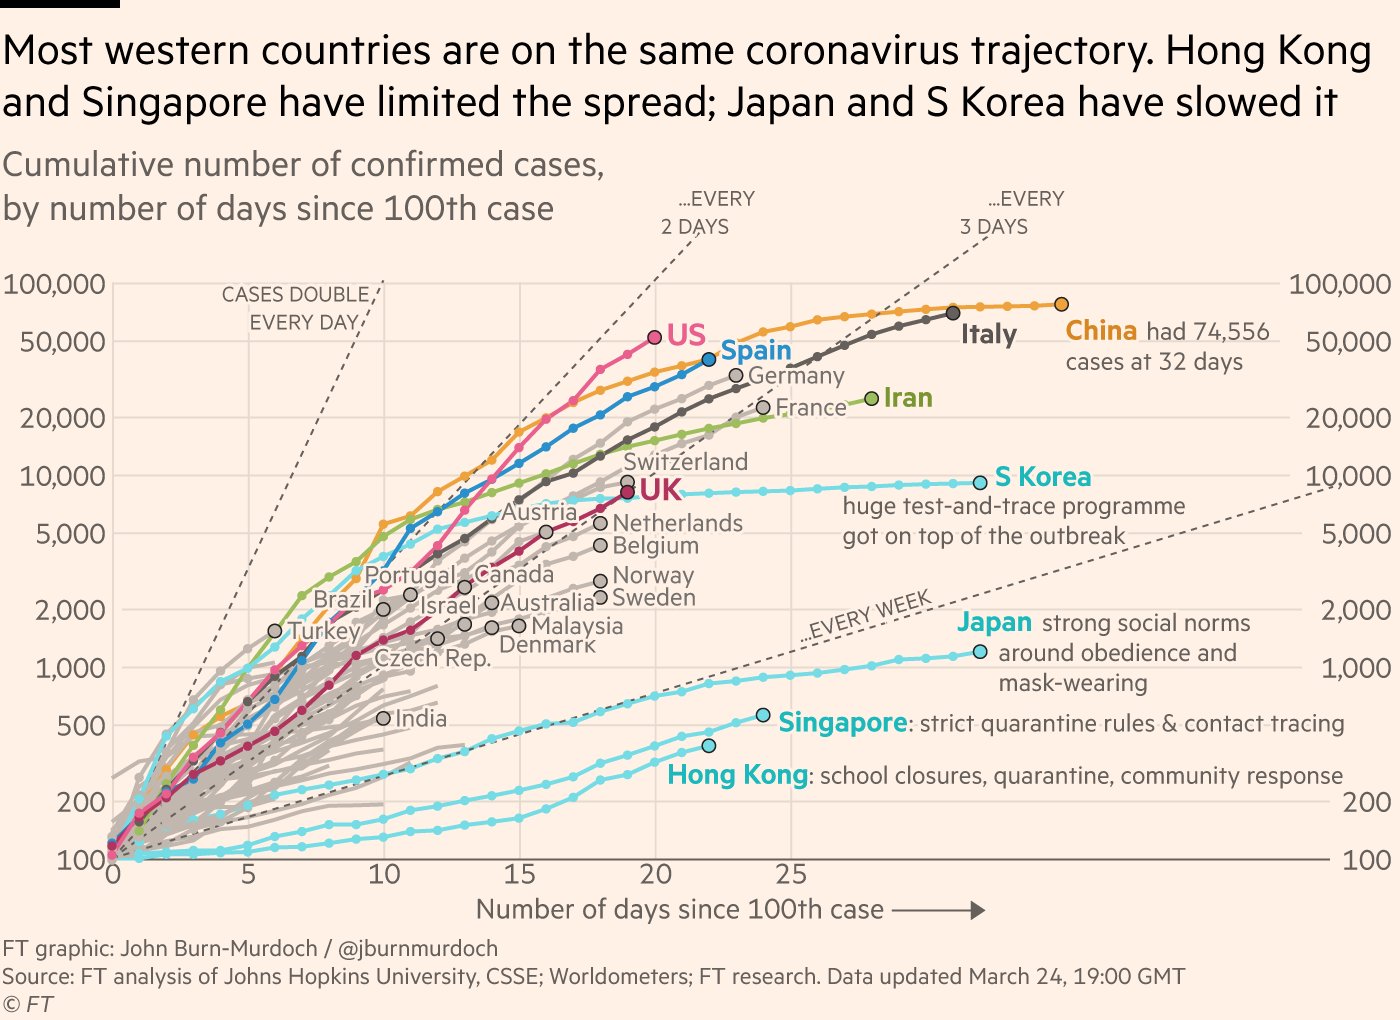
Covid chart
-
PostmanBitesDog
- Posts: 1428
- Joined: 17 Feb 2019, 15:46
- Gender: Male
Covid chart
The International Team Mapping the Real-Time Spread of Coronavirus
https://www.healthmap.org/covid-19/
The researchers of the Open COVID-19 Data Curation Group have seen what's worked in places like South Korea and Hong Kong to stem the spread of coronavirus, and how the U.S. is so woefully behind in its fight.
They've been on the case since the beginning.Think of it like Wikipedia, but an open database — curated by volunteers — that instead tracks and maps the real-time spread of COVID-19 around the world. Since the onset of what has become the COVID-19 pandemic, an international team of over 20 researchers has been aggregating information and developing publicly available datasets to help people study the outbreak as it evolves. Many of the researchers part of the Open COVID-19 Data Curation Group first connected in 2015 while working on a similar project during the Ebola outbreak in West Africa. But the scale of COVID-19 has already made this latest effort a much larger task.
“We didn’t necessarily anticipate in early January that this was going to become a pandemic,” says Samuel Scarpino, an assistant professor at Northeastern University’s Network Science Institute, who is a member of the collaboration. “It really is being operated now like the large scale project it has become”
The goals of the project are to make this raw data open to the public to inform how this outbreak began, give a real-time look at how the situation is changing, how it is unfolding both locally and globally and what is working to stem the spread. The information is being widely used by an array of individuals and organizations including the CDC, European CDC, and WHO.
The project is collaboratively led by Moritz Kramer of the University of Oxford, and David Pigott of the University of Washington in Seattle.
https://www.healthmap.org/covid-19/
-
Postie45
- Posts: 2158
- Joined: 21 Aug 2012, 23:05
- Gender: Male
Covid chart
Interesting how the Eastern counties were very quick to tackle the problem and looks like they'll reap the long term rewards. In the meantime we still see getting pizza leaflets delivered as more of a priority.